By Alex Stark
Check the Baseline: Inflation Without an Annual Number, Audits You Can’t Take at Face Value, Spot Rates 48% Above Last Year, and the Weather in Your Demand Plan
Reflecting on my intro last week, I may have come across a touch contemplative. It’s the early sunset that does it. It takes some getting used to. Of course, as seemingly every year, there is tons of discourse about turning the clocks back and forth. Bottom line, keep yourself on track. Get good rest. Thanksgiving and the jolly season are just around the bend.
I know it’s early for a map. However, please indulge me. I found this one fascinating. The combo of southern latitudes, western edges of time zones, and year-round standard time (Arizona and Hawaii have it figured out): these areas of the U.S. never experience the sun setting before 5 pm local time.
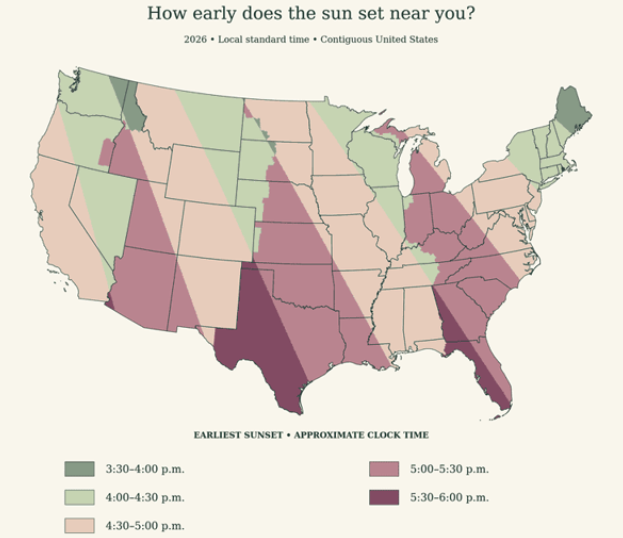
One more sunset fact while we’re here. The earliest sunset of the year doesn’t land on the solstice. At our latitude, it comes around December 8, and from there the sunsets start creeping later, even though the days keep getting shorter until December 21. Something to look forward to.
With this early onset of darkness, I have noticed many houses in my little corner of the supply chain with Christmas lights a-blazing. There was a time when I was bothered that Thanksgiving got boxed out, but I’m here for it now. Let there be (holiday) light. If that makes you smile and share in the happiness, well, how can that be bad? I am still firmly in the camp of no holiday music until the day after Thanksgiving. That’s a bridge too far. Respect.
As I noted back in October, Thanksgiving falls on November 26 this year, leaving just 29 days until Christmas. That’s a tight turn.
That sunset map is a good picture of this week’s theme. The same clock gives you a very different evening depending on where you stand. Every story I read this week turned on what a number is being compared to. Four things and a reminder to check the baseline.
Let me know what you’re seeing.
1. October Inflation Came in Hot, and It Has No Annual Number
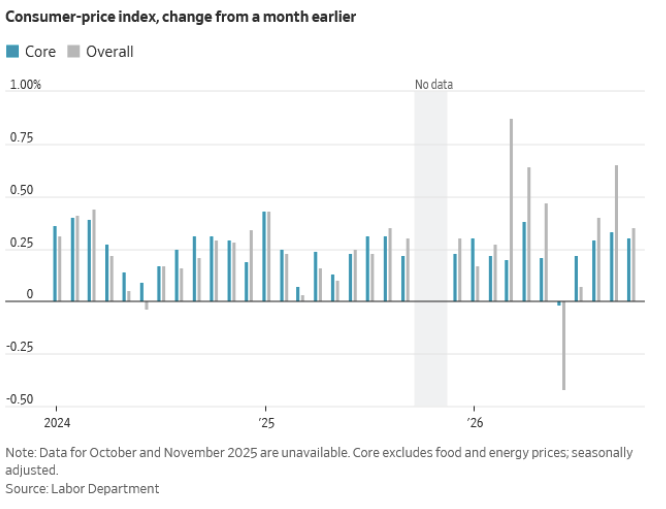
The October CPI report came out this week. Prices rose 0.4% for the month, above the roughly 0.3% economists expected. Core CPI, which strips out food and energy, rose 0.3% for the third straight month. Food rose 0.5%, the fastest since April. Appliances rose 1.3% and furniture 1.2%. Used cars, down 1.2%, were the main offset.
Why There’s No Annual Number
Here’s the knowledge nugget, and it’s an unusual one. The annual inflation rate compares this month’s prices with the same month a year earlier. The federal government was shut down from October 1 to November 12, 2025, and the Bureau of Labor Statistics (BLS) didn’t collect prices that October. No baseline, no annual rate. The BLS says it “cannot publish 12-month percent changes for October 2026” for the affected indexes.
That leaves the annual estimate to whoever fills in the missing month. Bank of America’s estimate is about 3.8%. KPMG’s is about 4.2%. Same report, a different assumed baseline, and a meaningfully different answer. The official annual rate returns with the November report on December 10, the day after the Fed’s next decision.
The Fed’s Read
The monthly numbers were enough for the hawks. Fed Governor Christopher Waller stated in London before the CPI release that if October core came in around 0.3% or higher…
In that case, I believe a 50 basis point hike in the policy rate should be considered at the December meeting. Hiking only 25 basis points would put our credibility at risk, a risk I am not eager to take.”
It came in at 0.3%. KPMG chief economist Diane Swonk’s read: “Hawks at the Fed are gaining traction.” KPMG says the October data “cinch” a December hike, and the open question is whether it’s a quarter point or a half.
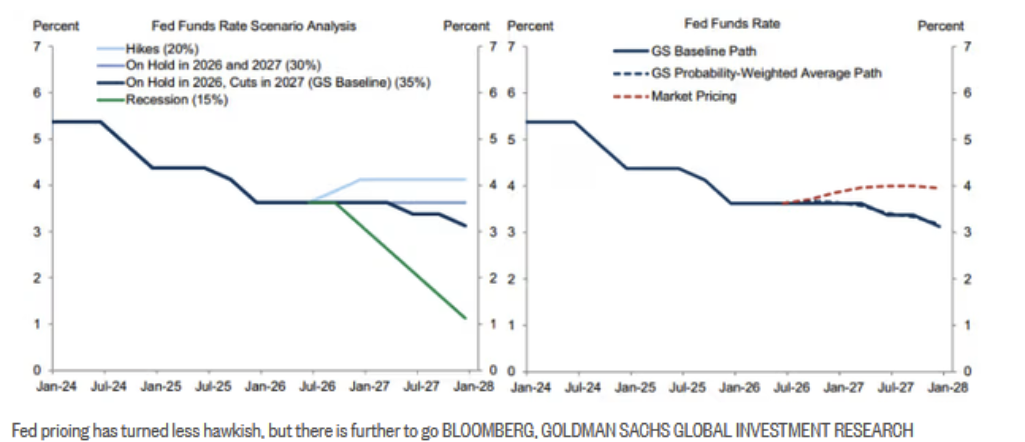
This is a thread I’ve been pulling all year. May’s 4.2%. June’s head-fake. The August call I got wrong. September’s 3.7%. Then in October, two Fed officials voted for a hike the committee didn’t take. Now core has posted three straight 0.3% months.
If you’re setting financing or pricing assumptions for early 2027, plan for another hike in December, and don’t rule out half a point. In addition, I’ve been reading that there might not be a decrease until Q4 2027.
2. Can You Trust a Supply Chain Audit in the Age of AI?
That’s the question Supply Chain Management Review is asking, and it seems like it’s on everyone’s mind. Generative AI, as SCMR puts it, makes “fraudulent supplier records, images and testimony easier to produce.” Factory photos, certificates, inspection reports, training logs, and signed attestations are all files, and convincing files are exactly what these tools are good at producing.
Too Perfect
Gabriel Oludare Fabiyi, an internal audit and compliance leader, described a case for ISACA in June that stayed with me. During a routine review, he received a document that looked “too perfect,” with flawless formatting, crisp signatures, and consistent details. It turned out to be AI-generated, with synthetic signatures and fabricated metadata. It wasn’t malicious, which made it all the more unsettling. If an honest shortcut looks like that, imagine what a determined bad actor can produce.
Fabiyi’s conclusion is a baseline shift. Audits used to start from a presumption that the evidence was genuine, then look for problems. He argues they now have to start from zero trust. Verify first, get evidence directly from the source systems, and treat unusually polished evidence as a reason to look closer.
Ask for What Can’t Be Prepared
It’s the same pattern as the Staples hack in October, where “once the login has occurred, trust is implied,” and the fictitious freight pickup, where the right paperwork gets a load released. It also reminds me of the Google experiment I shared in July that asked you to spot the AI image. “One of these things is not like the other.” That game keeps getting more difficult.
The practical move is to ask for evidence a supplier can’t prepare in advance. An unannounced visit. A live video walk-through of the floor. Records pulled directly from their system while you watch. A convincing document can be produced in minutes now. A live walk-through of a working factory floor is much harder to fake.
3. Spot Rates Have Gone Flat, at a Very High Level
The DAT Freight & Analytics reported October numbers, via CCJ, look calm next to September and anything but calm next to last year:
- Dry van: $3.05 a mile on the spot market, up 4 cents from September and 98 cents from a year ago. That’s DAT’s highest monthly average since February 2022.
- Reefer: $3.60, down 2 cents for the month and up $1.12 for the year.
- Flatbed: $3.61, unchanged for the month and up $1.10 for the year.
- Contract rates: dry van at $3.28 ties the May 2022 record. Reefer at $3.62 and flatbed at $4.05 are new records.
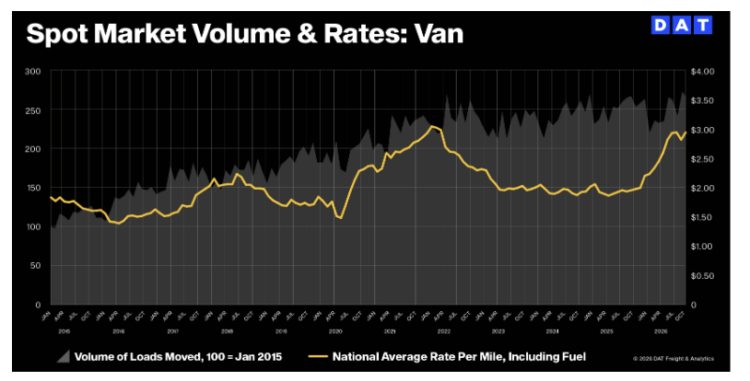
Underneath, capacity remains tight. Truck postings on DAT’s load board are running 22% to 26% below last year. Tender rejections (the share of contract loads carriers turn down) are at 12.9%, up from 6.2% a year ago. Diesel averaged about $6.25 a gallon in October, roughly $2.60 above last year. DAT Principal Analyst Dean Croke summed up the broker side:
Brokers moved fewer loads than a year ago and paid carriers about a dollar a mile more to move them last month. While fuel and other operating costs are high, carriers are heading into the holiday freight season in a position to be selective and negotiate better rates.”
Watch the Spread
Here’s a point worth noting. In a loose market, spot rates sit well below contract rates, so carriers are glad to haul contract freight at the agreed price. As spot rates climb toward contract rates, that cushion disappears. A carrier can make as much or more on the open market, so it has less reason to accept a contract tender. The load moves to the next carrier in the routing guide, usually at a higher price. Reefer spot is now within 2 cents of reefer contract. Dry van is 23 cents apart.
In October, FTR said rates would flatten, not fall. Two flat months at roughly 48% above last year is what that looks like. In September, I suggested checking any routing guide built during the soft market. If you haven’t yet, the spread is your reminder.
CCJ’s advice for shippers is sensible. Lock in essential lanes before the peak, consider intermodal or shared truckload for non-time-sensitive freight, and reserve premium pricing for lanes with real capacity constraints.
4. A National Forecast Can Be Right and Still Wrong Where It Counts
Darren Seifer of NielsenIQ wrote one of the most useful lines I read this week, in a SupplyChainBrain piece on weather and regional demand planning:
A product plan can be accurate in aggregate and wrong in the locations where inventory sits.”
Seifer’s evidence is from summer 2025, when one national plan met four very different summers. Pest control sales rose 11% in the Northeast, where warm nights kept insects active, and fell 4.1% in the dry heat of the West. Mold and mildew prevention products rose 47% in the Midwest and 31% in the Northeast after flooding. Nationally, the year looked unremarkable. Region by region, some shelves were overstocked, and others ran short.
The baseline problem is built into how most plans work. Historical sales reflect last year’s weather, so planning off history assumes that weather will return. Seasonal assumptions are drifting as well. According to NOAA data Seifer cites, the South’s October-through-March average temperature has risen about 1°F per decade since 2000, pushing cold and flu demand later and softening the peak.
Match the Forecast to the Decision
- Decades: where facilities go and which regions hold seasonal inventory.
- 30 to 90 days: regional allocation, initial buys, and pre-positioning before a season opens.
- 2 to 6 weeks: moving product around once the season is underway.
He also suggests trigger thresholds that automatically move product when conditions are met, because a category that peaks over three weeks can lose a third of its season while waiting for the weekly review. The weather data is free and public, published before the purchase orders go out.
Back in July, writing about the super El Niño, I said weather has graduated from a footnote to a baseline planning factor. This is what that looks like at the shelf. Phoenix and Boston might be in the same distribution tier, but they won’t have the same winter.
Deciding where inventory sits is the core of what a warehouse network does. Getting it right, region by region, is where good planning meets extraordinary service.
Check the Baseline
October inflation ran hot, and its annual rate depends on which missing month you assume. Audit evidence used to be trusted, and that starting point has shifted. Spot rates look flat until you compare them with last year. And a national demand plan carries last year’s weather inside it.
None of these numbers is wrong on its own. The trouble starts when you forget what it’s being compared to. The same goes for the sunset map. Five o’clock means something very different in Tucson than in northeast PA. Plus, we’re getting the first taste of snowfall as I write this.
Bonus #1: The SS United States
Growing up in the Philly region, it was hard to take your eyes off the SS United States. Its massive frame (990 feet long, compared to the RMS Titanic’s 882 feet, 9 inches) sat dormant on the Delaware River in South Philadelphia after it was towed there in 1996. It was always there, a reminder of glorious days gone by. Truthfully, Philly, especially in my younger days, always felt like that. But that’s a story for another time. We all rejoiced when the grand old ship became the world’s largest artificial reef off Florida’s Gulf Coast.

Here’s a pretty thorough article on the ship, its glamorous history, and the preparation for its final resting place for scuba adventurers and tons of fish to enjoy.
The final chapter came Wednesday evening, on Veterans Day. Around 4 p.m., crews began opening more than a dozen valves, and it took about five hours for the ship to go under, roughly 22 nautical miles southwest of Destin-Fort Walton Beach. It landed upright in about 180 feet of water, with the top deck about 60 feet below the surface. It now serves as the world’s largest artificial reef. It still holds a record, too. On its 1952 maiden voyage, it crossed the Atlantic eastbound in 3 days, 10 hours, and 40 minutes, averaging 35.59 knots, about 41 mph. No ocean liner has gone faster. Local dive operators planned their first trips down as soon as today. Jocelyn Collins of Emerald Coast Scuba: “I think it’s going to be like Disney World.”
Bonus #2: Not a Wedding Crasher
There have been some top-tier movie comedies produced over the years. Wedding Crashers is certainly in that discussion. With the average cost of nearly $300 per guest for a wedding, no one is excited about the stress of possibly not meeting the minimum venue headcount. Solution? Not a Wedding Crasher. There is an app for everything. No invite? No problem.
Jeff and Karina Besen, a San Diego couple, launched it in March. Couples list their open seats and set a price, usually around $50. Guests verify their identity with a government ID and a face scan, and the venue address is shared only after the couple approves them. As Jeff Besen put it, “You may have to pay for 100 seats, and you can only get 75 people.” Nearly 1,000 guests have attended about 60 weddings so far. In a week about verifying what’s real, even the wedding crashers get an ID check.
Bonus #3: Stacking Pigs
Other than the script that’s used, which, for my tired old eyes, causes a bit of a strain, this week’s find was a cute delight. Stacking pigs as they hover across the screen on bubbles. Intrigued? Check it out. I’m all about keeping my timing sharp.
And to confirm, if I’m offering a fun, five-minute brain diversion, it will meet two criteria. One. Nothing to download. Free and clear. Two. Can’t be overly complicated. Get right to it.
The goal is to stack your pigs high enough to reach the floating cupcakes. Birds carrying clocks add time, and seven fallen pigs ends the game. It comes from Ferry Halim’s Orisinal, a collection of small, gentle browser games he started in 2000.
You’re welcome.
One Last Thing… 14,000 Satellite Trails
I’m a fan of people who take the time to construct something truly unique or present an interesting point of view. I found this genuinely cool and shocking at the same time. Brendan Larsen photographed the night sky over Mt Taranaki (a dormant, 8,261-foot volcano on the west coast of New Zealand’s North Island) for nearly two hours. He ended up capturing 578 photographs. Larsen’s photos revealed over 14,000 satellite trails. He then manually traced every trail in the photos to stitch together this remarkable image.
Each frame was an eight-second exposure, and about 1,400 satellites appear across them, roughly 25 per photo. The editing took him about 45 hours. In his words: “I manually masked in EVERY SINGLE TRAIL from the original photographs.” And in a week when I wrote about AI fakes, here’s a fitting twist: many people accused the image of being AI-generated. Larsen responded by posting a video of his process.
Right!? Stunning and disturbing.
When you’re not looking up, remember, it costs nothing to be kind.