Business Cycle Indicators
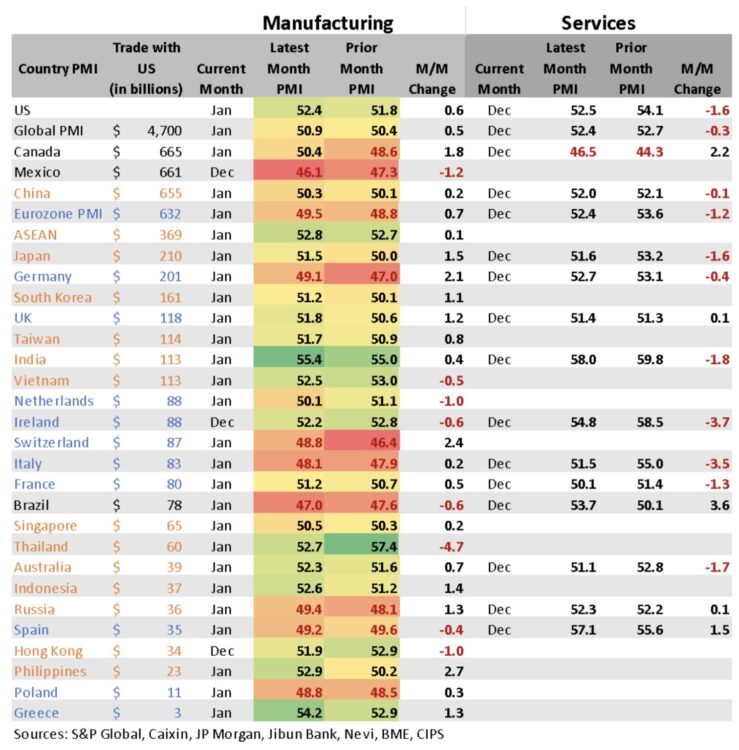
The chart below serves as an early warning indicator of business cycle changes. It tracks the Purchasing Managers’ Index (PMI).
PMI is a widely used economic indicator that reflects activity levels in manufacturing and services, based on data from purchasing managers across multiple industries. Because it captures changes in new orders, production, employment, supplier deliveries, and inventories, it’s often viewed as a leading indicator of business cycles.
At a high level:
- A PMI reading above 50 suggests economic expansion
- A PMI reading below 50 suggests contraction
- Month-over-month changes can signal shifts in demand before they show up in financial results or volumes
U.S. Consumer Spending
Much has been written about the current ‘K-Shaped’ economy. The bottom line is that consumer spending in this country is the main driver of the economy. According to data, consumer spending accounts for approximately 70% of U.S. GDP. To put that into perspective, the International Monetary Fund (IMF) estimates the U.S. GDP at $31 trillion.
So yes, 70% of $30 trillion is an enormous amount of money.

Consumer spending has remained surprisingly resilient despite turbulence both domestically and globally. The boogie man is the job situation.
Without employed consumers there is not much economic activity. The challenge is that people react to job data in a very personal and direct way. Even if they have not been laid off, they worry. If they see people in their company or industry losing their jobs they start to wonder when they will be next. A bad jobs report pushes people to become more cautious and that means reduced spending. Given that the economy of the US is sustained by consumer activity this is a bad trend.