By Alex Stark
Costs Stopped Listening: A Bond Selloff, Capacity That Loosened While Prices Rose, Another 12% on the Last Mile, and Retailers Cutting Variety
I think I’m mentally past summer and now fully in fall mode in my little corner of the supply chain. But the calendar says this is the last official weekend. Get out there and enjoy the Labor Day weekend. Winter will be here before we know it.
Four things caught my attention this week, and three of them described the same strange thing. Costs went up even though the factor that usually drives them went down.
The Fed is holding steady, while long-term borrowing costs jumped to their highest level since 2007. Transportation capacity loosened significantly in August, yet transportation prices climbed. Last-mile delivery costs rose by 12% for the second consecutive year, a trend the executive presenting the data now calls the new normal.
The usual relationships came unhooked. The fourth story is what companies are doing about it.
Let me know what you’re seeing.
1. The Bond Market Did Exactly What We Talked About Two Weeks Ago
The 30-year Treasury yield climbed as high as 5.337% on August 18, its highest level since 2007. The 10-year now sits near 4.7%, up from 4.2% at the start of the year. The Treasury responded by at least doubling its long-dated buyback operations, from $2 billion to $4 billion, running from September through November, which pulled the 30-year back to about 5.19%. The question is what it means for consumers and, by extension, for anyone selling to them.
Two weeks ago, I wrote about the national debt passing $40 trillion and made this exact point. Heavier Treasury issuance pressures yields regardless of what the Fed does with the short-term rate, so it is entirely possible for the Fed to hold or even cut while your borrowing costs remain unchanged. Here it is, faster than I expected.
What It Does to Households
Mortgage rates track the 10-year, and Mark Fleming, chief economist at First American, put the trajectory plainly:
This is going to push mortgage rates much closer to 7%.”
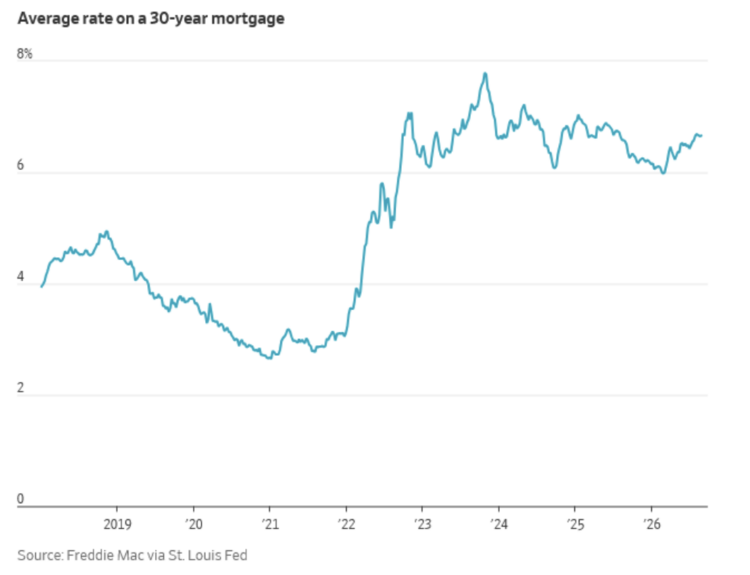
Freddie Mac reported that 30-year rates averaged 6.66% (that’s ominous on its own) last week. They briefly dipped below 6% in February, sparking optimism, before the Iran conflict pushed them back up, turning the spring selling season into a bust. Zillow’s Kara Ng noted that the factors pushing yields higher are unlikely to fade soon, so rates may stay elevated for a while.
What It Does to Your Balance Sheet
Treasury yields also undergird corporate bond pricing. Your equipment financing, facility debt, and revolver all reprice off this, not off the fed funds rate that gets all the headlines. There’s a second-order effect worth noting, too. If the selloff persists, it could pressure the stock market rally that has been supporting both consumer spending and the AI capital boom.
This also connects to last week. The Conference Board showed consumers feeling roughly okay about now and worse about six months out. Higher mortgage and auto rates are exactly the mechanism that turns souring expectations into deferred purchases.
Rate relief is not the plan. Build your 2027 capital assumptions around borrowing costs at or above today’s and stop watching the Fed as though it’s the only thing setting your rate.
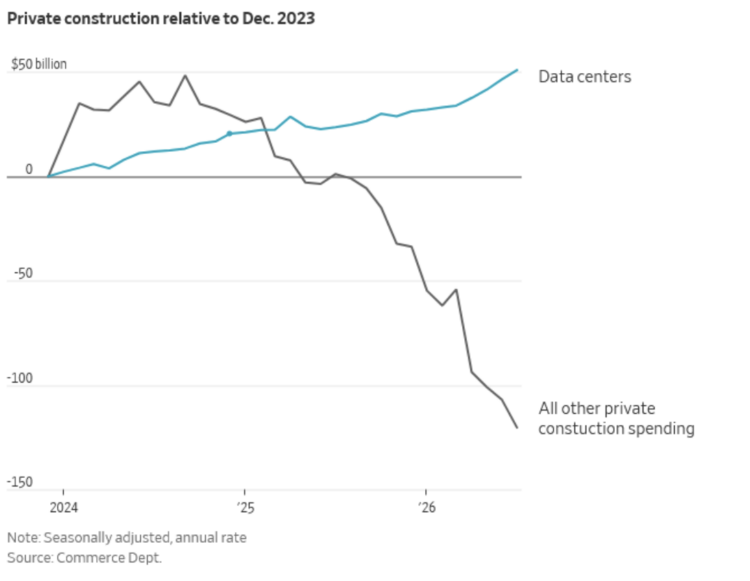
I thought this graph was pretty telling. I’ve heard the U.S. economy described for months now as basically a bet on AI.
2. Capacity Loosened, and Prices Went Up Anyway
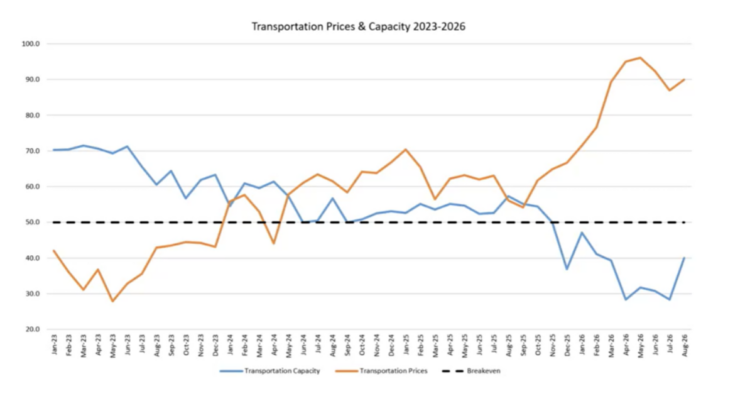
The August Logistics Managers’ Index came in at 66.6, down 2.2 from July and 4.4 below June’s four-year peak of 71.1. Still firmly expansionary. The interesting part is underneath the headline.
- Transportation Capacity: 40.0. Still contracting, but the rate of contraction slowed by 11.6 points from July’s 28.4, which was the second-lowest reading in the history of the index. That is meaningful relief.
- Transportation Prices: 90.0, up 3.1. Fourth time in five months at or above 90.
- Warehousing Capacity also loosened, up 7.2 to 53.5, and warehousing prices barely moved.
Capacity came back online, and prices went up. That is not how this normally works. The report notes that prices continued to climb despite additional capacity coming online. I was on a CSCMP webinar (which supports the LMI) earlier this week for a live presentation of August’s results. On transportation, the graph below shows this divergence.
The Rest of the Picture
Inventory Levels eased to 52.8, barely above the expansion line, with upstream respondents contracting at 49.0 and downstream at 61.9. That split suggests retailers are rebuilding for Q4 after the back-to-school drawdown. Inventory Costs accelerated to 78.6, the second-fastest expansion in twelve months, and aggregate logistics costs rose 4.1%. Dr. Zac Rogers noted that the March-through-August average represents another statistically significant step up.
The report attributes much of this directly to the Iran War. The index has averaged 69.0 over the five months since the war began, compared with 58.5 over the preceding five months.
There’s also a genuine disagreement in the forward numbers worth noting. Looking twelve months out, upstream companies expect significant capacity tightening at 38.6. Downstream retailers expect modest capacity to become available at 54.5. Two groups are looking at the same market and forecasting opposite outcomes.
If you have been waiting for capacity relief to translate into rate relief, August says it may not. Record-low diesel inventories, which I covered over the past two weeks, are doing much of the work here. Price your freight budget based on cost inputs rather than capacity headlines.
The Logistic Managers’ Index is an excellent resource for supply chain trends. The report is produced monthly by researchers from Arizona State University, Colorado State University, the University of Nevada, Reno, Florida Atlantic University, and Rutgers University.
3. Last-Mile Costs Rose 12% Again, and Nobody Trusts AI to Fix It
FarEye’s survey of U.S. delivery operators, presented by CEO Kushal Nahata at Last Mile Leaders America in Chicago, found that median last-mile costs rose 12% in 2026, matching the increase from a year earlier. More than 3,000 data points went into it.
The distribution is worse than the median suggests:
- Six in ten operators reported increases above 10%.
- One in five reported increases above 20%.
- 88% said delivery cost is growing as fast as revenue or faster.
- Only one in eight is creating operating leverage.
Nahata said they had assumed last year’s double-digit jump was an anomaly. Having seen it twice, he now describes near-double-digit annual cost growth as the new normal.
Operators Will Let AI Predict. They Will Not Let It Decide.
This is the most interesting data in the report. Operators at the implementation or operational stage of AI rose from 46.2% in 2025 to 66.3% in 2026. Extensive operational adoption increased from 4% to 13.8%. A big jump in a single year.
Now look at where it’s being used. ETA prediction leads at 39%, then demand forecasting at 36%, then customer support at 31%. Real-time dynamic routing, the only use case on that list that makes an actual operational decision, comes dead last at 21%. Mean trust in AI for real-time operational decisions sits at 1.98 on a four-point scale.
Adoption jumped twenty points in a year, yet the trust number remains below the midpoint. I don’t read that as resistance to technology. I think about it as a rational assessment of what happens when a routing decision goes wrong at four o’clock on a Friday. It also aligns with the Gartner finding I covered on August 7th, in which two-thirds of supply chain digital spend goes to AI, while 55% of chief supply chain officers can’t say what it returns. Prediction is easy to buy. Execution requires trust, and trust must be earned.
Back in June, I wrote about the exurban boom and the point that population moving 40 and 50 miles past the existing distribution footprint redraws the last-mile map. Twelve percent, two years running, is what that looks like on an invoice. If last mile is in your cost structure, plan on double-digit annual increases until something proves otherwise.
4. Retailers Are Cutting Variety, and It’s Harder Than It Looks
Retailers and brands are aggressively cutting SKU counts to offset tariff and freight costs, and the examples are stacking up fast.
- Under Armour has trimmed its SKU mix by more than 25% over two years.
- BJ’s Wholesale Club plans to cut about 20% of SKUs over the next couple of years, from roughly 7,500 per legacy club down to 6,000 or 6,500. CEO Robert Eddy said the company is over-SKUed and is targeting what he called unnecessary choice.
- Levi Strauss is cutting SKUs even while expanding into new categories, eliminating underperforming styles and colorways to protect full-price sales. It sold Dockers to Authentic Brands for $311 million to concentrate on core denim.
- Hasbro described a significant amount of SKU reduction alongside a sourcing shift from China to India.
The logic is sound. Holding slow-moving stock became both costly and risky. Excess inventory forces markdowns or incurs storage costs, and unpredictable tariffs on unsold goods can wipe out the margin entirely. Fewer SKUs mean leaner warehouses, faster turns, simpler sourcing, and less tariff exposure.
The Part Worth Considering
Eddy was refreshingly candid on BJ’s August earnings call, saying that BJ’s has tried this before and gotten it wrong. Describing the earlier attempt:
We just cut SKUs, which cut sales.”
And then, he said, they added some of the SKUs back. That is the entire risk in one sentence. SKU rationalization done well removes duplication. When done badly, it removes the reason someone shopped with you in the first place.
This pairs directly with last week’s story about Target and Walmart competing on consistency and in-stock reliability. It’s the same strategy from the other direction. Fewer SKUs make high in-stock rates achievable in the first place. You cannot reliably be in stock on everything, so you narrow what “everything” means.
Here’s the part that lands closest to home for us. Complexity is a cost that hides in the network rather than on the invoice. Every additional SKU is another forecast, another slot, another pick path, another minimum order quantity. Cutting requires knowing which items earn their place, and that is a data and distribution question before it is a merchandising one. It’s the kind of work we spend our days on.
So, if you’re being pushed to simplify, simplify using real velocity and margin data rather than a percentage target handed down from above. The percentage target is how BJ’s got it wrong the first time.
Costs Stopped Listening
The Fed held (now now), and long-term borrowing costs rose. Transportation capacity eased, and transportation prices climbed. Last-mile costs rose 12% for the second straight year, regardless of conditions. The relationships we normally use to forecast costs aren’t working as they should right now.
When the usual signals stop predicting, you have two options. Keep waiting for them to start working again, or narrow the number of things you have to forecast. The retailers cutting SKUs chose the second option, and I think that’s the right instinct. The BJ’s story is a reminder that it still has to be done with real data rather than a target number. Simplification might be a strategy worth considering.
What’s gotten more complicated than it needs to be in your operation?
Bonus #1: Eggs Over Easy with a Side Order of Slop
I found this genuinely disturbing, and I’m not trying to be cheeky. We all feel surrounded by AI, but these food graphics might be a bridge too far. Bizarre AI-generated food images are jumping from online straight onto real menus. Here’s your side order of slop. Unappetizing… 100%.
There’s a business lesson buried in it, too. When the picture doesn’t match the plate, it’s a customer-expectation problem, and those are expensive to fix.
Bonus #2: Octopuses Might Be the Smartest Thing in the Ocean
I have not read the book (yet), but I watched the movie Remarkably Bright Creatures this past summer. It’s adapted from the bestselling novel of the same name. I’m all for a story or article about an octopus. I think they are fascinating.
This Smithsonian piece covers a never-before-seen mutation that appears to help octopuses build proteins with unusual accuracy, which researchers think may be part of why they’re so intelligent. Because protein misfolding sits at the center of diseases like Alzheimer’s and Parkinson’s, there’s early speculation about therapeutic relevance. Emphasis on early, but it’s a fascinating thread to pull.
And yes, I did cry at the end of the movie.
Bonus #3: Don’t Wordle
Most people know, or have played, Wordle. The game was developed by Josh Wardle, a Welsh software engineer, and released to the public in 2021. Basically, a player has six chances to guess a five-letter word. It became an almost instant success, so much so that The New York Times Company acquired it in January 2022.
If you’re into challenges along this theme, check out Don’t Wordle. Same gameplay as Wordle, except the goal is not to guess the hidden word.
Good luck.
You’re welcome.
One Last Thing… The Bundy Clock
As part of its ongoing series, “A History of the United States in 100 Objects”, 99% Invisible highlighted the time clock. I remember one of my earliest jobs as a teenager, punching in for my shift.
Really cool story about how something was created that completely changed our relationship not only to work, but to time itself. Fitting for a week spent talking about what gets measured.
Remember, it costs nothing to be kind.