U-6 Unemployment Rate Starts to Hint at Underlying Problems
The good news is that the Federal Reserve may be getting the fodder it needs to trim interest rates. Weaker-than-expected economic growth is now coupled with signs that the labor market may be slowing.
One of the most useful measures of unemployment is the U-6 rate. The U-6 is like the U-3 unemployment rate (the one most reported), but it includes more than just those filing for unemployment. It also includes the underemployed, those forced to work part time because they can’t find full time work, and those discouraged or missing from the labor force.
The chart below shows the U-6. Note the recessions on the chart, and one can see a correlation with the U-6 showing positive year-over-year growth (a positive increase above zero). The current U-6 just reflected positively and is up 12.1% from last year at this time. Although this rate of increase is lower than the 2001 surge of 36%, it bears watching. It is difficult to find another period when the U-6 moved higher that didn’t end in a recession.
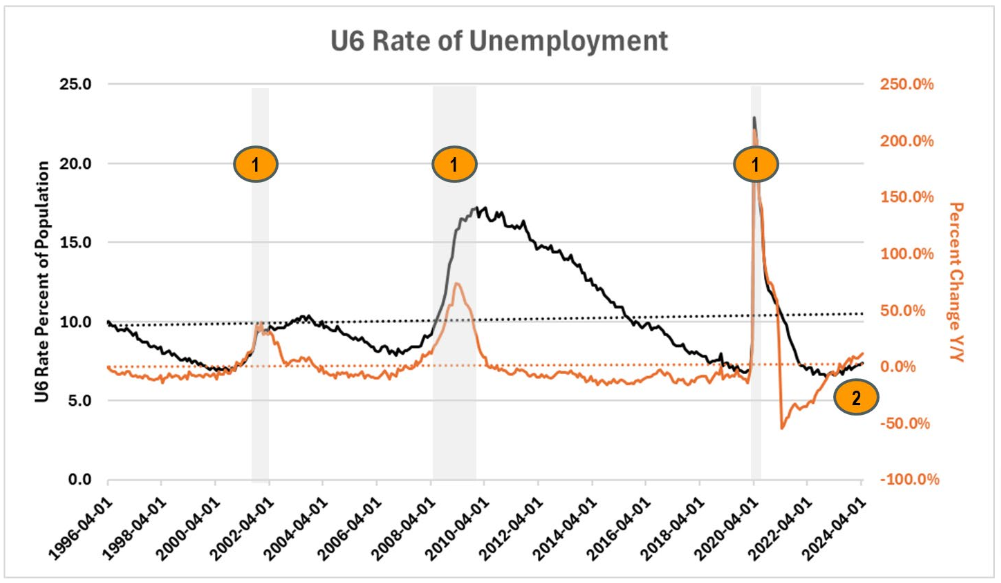
The US has created more part-time jobs over the past year and has shed full-time jobs. That shows up in the U-6 among people that mentioned that they were working part-time but wanted full-time work. More importantly, part-time work changes household income and forces those households to be more vigilant on spending. There are traces of that in the retail data as discretionary spending categories are dropping while essential spending (food, fuel, health care) is still stable.
Again, is this a problem yet? No, but it could create a cycle change. The Federal Reserve may be able to offset this with a rate cut or two, but there are more underlying problems throughout the labor market.
Business executives are beginning to talk about “trimming” across all facets of their business. Many are trimming because they can feel their customer bases pushing back on selling price increases, but their operating costs are still high. They must adjust, or profit margins will start diving.
What Is Going on With Gasoline Demand?
There is no question that analysts are frustrated with data revisions and problems getting accurate economic data upfront. Recently, there was a debate over a Department of Energy chart that went viral.
The chart is at right, and it shows daily gasoline demand. But why has it hit the lowest levels since the lockdown?
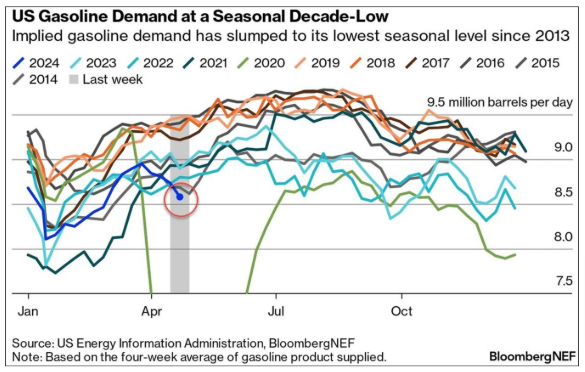
- Could it be EVs? EV sales are up 48% year-over-year, but they still make up less than 1% of all vehicles. Certainly, that level of EV utilization wouldn’t be enough to strip out nearly 500,000 barrels a day of gasoline usage out of the market. The ratios don’t make sense.
- Work-from-home? Perhaps, but it does seem that more people are going back to the office today than they were in 2022 and 2023, and commuter traffic is the number one consumer of gasoline. One could justify the gap between 2019 and 2021-2024 as just that, the difference between everybody commuting and work-from-home trends. But to see 2024 plummet this deep, that explanation won’t cut it.
Where everybody has netted out on this is that it is real demand destruction. Maybe jobs reports aren’t as accurate as thought? Maybe some of the charts that show real economic weakness should be taken with more credibility?
For instance, in a follow-up to the University of Michigan story from page one, Zero Hedge and others are pointing out that this was the biggest miss in history…do economists just have it that wrong? Or will there be revisions in the next couple of weeks telling us that the first half of May was a data anomaly?
Everybody is trying to get a firm reading on the economy. It took the National Bureau of Economic Research (NBER) until December of 2008 to officially call the recession that started in December of 2007. By the time the NBER calls an official recession, the real world has been in the throes of it for several quarters. That’s why analysts continue to try and get out in front of any data points that help tell the full story. This is just one input, but it is a confusing one.
Canada Sees Drastic Drop in Exports
Suddenly, Canada is sporting a significant goods deficit with the rest of the world. There was a drop of $1.6 billion when analysts expected there would be a surplus of $1.2 billion. The level of merchandise exports fell by 5.3%. After two quarters of export increases, this last reading was down by 1.4%. This deficit is having an impact on the thinking of the Bank of Canada and may ensure that rates fall in June. Inflation numbers are still low, and now there are real fears of a slowing economy. Nine of the eleven categories saw declines, and some declines were steep. Energy products were down by 4.9%, and automotive was down by 6.3%. Exports to the US in general were down 5.0%. This is bad news for Canada, but it also signals issues for the US as a great deal of that trade is intercompany. These companies may be slowing down.